Open Source Software (OSS) Usage in East Africa


Chndy Rogel, Stephanie Coker
An online survey was conducted to develop understanding of data collection, analysis, visualization, and reporting tools that monitoring, evaluation, research, and learning (MERL) practitioners in East Africa use. The survey also sought to determine the rationale for choosing those tools, their effectiveness and efficiency, as well the barriers to using alternative tools. The research also aimed to determine familiarity in the usage of open source software (OSS) among respondents. While overall OSS adoption and usage in Africa has increased in the last two decades,several early studies have placed Africa behind other geographic regions (See reference 1-3). Most recently, a 2022 study on the geography of open source software found that no African country was in the top 30 countries of active OSS contributors on GitHub while only one African country was in the top 50 countries ranked by number of OSS developers per capita. Very few studies have been conducted on a sub-regional level. This article summarizes the result of a small study which can serve as the basis of future research on use of OSS across Africa.
Methodology
The survey was developed using LimeSurvey and distributed to contacts within the MERL Center and colleagues in the MERL network, who then shared the survey with members of their network. Moreover, the survey was emailed directly to a number of research and evaluation organizations in the region. A snowball sampling method was employed.
Table 1 below shows the six sections covered in the survey questionnaire.
Table 1: Survey sections and description
| No. | Section | Description |
|---|---|---|
| 1 | About your organization | This section gathered information on the sector in which the participant worked (e.g., public sector, private sector, academia, etc.), the geographical scope of the organization’s operations, and their thematic focus. |
| 2 | Your role in the organization | This gathered information on the respondent’s experience in MERL and in their organization. |
| 3 | Tool usage | This included questions on the tools used for data collection and management, data analysis and visualization, data reporting, and the organization’s general level of proficiency in those tools. In addition, it also asked questions on the tools’ cost and time efficiency, the challenges that the organization faced in using those tools, and the type of training that they received. |
| 4 | Tool selection | This section asked about the factors that organizations consider in selecting tools as well as people involved in the decision-making process. |
| 5 | Process assignment | This included questions on which staff are involved in each of the MERL processes. |
| 6 | Familiarity with OSS | This section sought to gauge the respondent’s familiarity with OSS and whether they had alternatives to proprietary software. |
Respondents
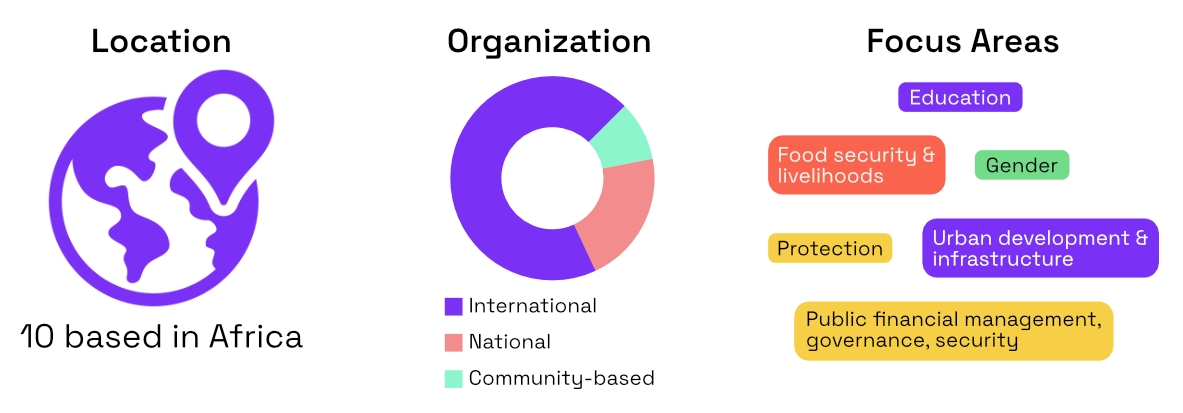
A total of 43 individuals responded to the survey, which included individuals who currently work or used to work in the region. A little more than a third (37.2%) mentioned where they were currently based. Among those 16 individuals that provided their current location, 10 said that they were based in a country in Africa. Most of the respondents did not identify the type of organization they belong to (65.1%) while 16.3% and 11.6% identified themselves as employees of an NGO or work in the private sector, respectively. However, only 15 respondents (34.9%) completed the survey. Among the 15 respondents who completed the survey, 11 individuals (73.3%) work for international organizations, followed by national (3; 20.0%) and community-based organizations (1; 6.7%) operating in Djibouti, Ethiopia, Somalia/Somaliland, South Sudan, Sudan, Tanzania, and the Democratic Republic of Congo (DRC). Respondents work in organizations with a variety of and overlapping thematic areas of focus, primarily gender (6 organizations; 40.0%), protection (6; 40.0%), education (5; 33.3%), food security and livelihoods (5; 33.3%), and urban development and infrastructure (5; 33.3%). In addition to these, some respondents also mentioned working in other areas (5; 33.3%) such as public financial management, governance, and security. In terms of respondents’ MERL experience, 13 respondents are MERL practitioners (86.7%), of which six (46.2%) have one to 10 years of experience and five (38.5%) have been working in this field for more than 10 years. Ten respondents (66.7%) have been working in their respective organizations for up to three years.
Tools: Selection, training, and usage
Respondents identified a mix of proprietary and open source software in performing tasks related to data collection and management, data analysis and visualization, and data reporting (tasks are categorized according to workflow categories articulated in this MERL center article). Moreover, some of the respondents discussed the challenges they face in using these tools. One of the respondents noted that the nature of their research is a factor to consider in using tools. For example, studies that are highly qualitative in nature only require a voice recorder during data collection and the researchers use Microsoft Word or Excel for preparing interview notes. It is only during data collection when people may opt to use applications such as Excel or a qualitative coding software (e.g., Dedoose, Nvivo).
“[For] most of the data collection, the main methodologies are qualitative in nature, so the technology used are a voice recorder and a word processor. Sometimes, mobile surveys are used. In the last project [I was involved in], we were collecting quantitative household panel data… using Kobo mobile data collection.” (Independent consultant, Somaliland).
For some organizations, the data they collect do not require sophisticated tools for data collection, analysis and reporting.
Respondents were asked to mention the tools that they use for the different phases of the MERL technology workflow. Table 2 summarizes the tools that were identified, as well as the challenges that organizations face in using these tools. Most of the respondents identified more than one tool for each phase of the technology workflow. Respondents were asked to mention the tools that they use for the different phases of the MERL technology workflow. Table 2 summarizes the tools that were identified. Most of the respondents identified more than one tool for each phase of the technology workflow.
Table 2: Tools used by respondents
| MERL technology workflow | Tools | Frequency |
|---|---|---|
| Data collection and management | Open Data Kit (ODK) Collect | 3 |
| KoboToolbox/Kobo Collect | 2 | |
| SurveyCTO | 2 | |
| DHIS2 | 1 | |
| Excel | 1 | |
| MES | 1 | |
| Data analysis and visualization | Excel | 5 |
| Stata | 3 | |
| R | 2 | |
| PowerBI | 2 | |
| DHIS2 | 1 | |
| EPI Info | 1 | |
| MES | 1 | |
| Data reporting | No software specified, mostly channels or format of reporting such as social media, website, policy briefs |
Challenges:
Respondents were asked about the challenges around using open source software, and they cited specific products, organizational issues, and M&E-specific challenges.
Products
- DHIS2 has gotten better in terms of data collection and visualization over the years, though it still has a long way to go.
- PowerBI requires expert knowledge to use well for data visualization but is much more robust than managing data using DHIS2.
- KoboToolbox is simple to configure for data collection, more than DHIS2, but has weak analytical functionalities.
Organizational issues
- The organization is not willing to purchase proprietary software licenses (e.g., Stata), as a result employees purchase their own personal licenses or find a trial version.
- Standardization is a key challenge because different units use different tools and methodologies making compilation of data difficult, and there is no single platform or software used by all sectors
- There is an insufficient number of people within the organization who are well-versed with the tools and there is also limited skill transfer or capacity building within the organization..
Monitoring and evaluation
- Some of the tools are very complicated for beginners or non-MERL experts, and some of them do not have dashboard features to show quick analyses or descriptive statistics for indicators being analyzed.
Seven of the 15 respondents noted that they have received training for using the tools that they use in their organization, primarily in-house. Most respondents think that people responsible for the above tasks have a high level of proficiency in using the tools mentioned. Both international and national staff were involved in the entire MERL technology workflow, but international staff were more likely to be involved in data analysis and report writing.
The main factors they consider in selecting tools to use to complete their MERL tasks include ease of use and industry standards. Ease of use refers to how intuitive the tools are, how easy they are to configure and navigate, and whether or not tools require formal training. Moreover, one of the respondents noted the interoperability of tools to allow for collaborative work. One of the respondents mentioned using OSS, “[Using] open source so that everyone working together can have access.” As mentioned in the table above, standardization of tools within the industry or sector is an important factor to consider because it implies that the tools are commonly used and therefore there is a wealth of technical support available.
Among the six respondents that identified the decision-maker on which tools to use to perform MERL tasks, four said that their director, team leader, or the head of the organization made the decision. This is consistent with findings from research conducted during the design phase of the MERL Center. The study found that decision-making on technology use in the social sector does not lie with information technology (IT teams) but rather with management teams in-charge of making budgetary decisions.
Familiarity with OSS
The series of questions under this section aims to determine if respondents know what tools are considered OSS and why they are considered as such. Four of five respondents said that they were either fairly or very familiar with OSS. Respondents were asked what they knew about OSS - (1) the source code is publicly available, (2) users can contribute to the development of the software, and (3) there are little to no financial costs involved in using the software, but data hosting, protection, and sharing could be challenging. One respondent gave examples of OSS that they know about such as ODK and QGIS.(Note: While open source software is often free of financial cost, the term ‘free’ in Free and Open Source Software or FOSS usually refers to the principle that source code is free to use and modify).
Conclusions
Although survey participation and completion was limited, results provide a qualitative snapshot of tool usage for MERL in East Africa and could serve as a basis for future studies on the topic. From feedback provided, respondents were more readily able to identify software tools for data collection and management and data analysis and visualization than reporting tools. Respondents also continue to use a mix of proprietary and OSS tools and most were familiar with OSS, which is largely consistent with the general trend wherein the use of OSS has been gaining popularity. It was interesting to note that while over half of respondents received tool training within their organizations, standardization across sectors, skill transfer, and capacity-building challenges still remained. Additional areas to conduct further research could include training and capacity-building opportunities for learning about tools (proprietary and open source) used in MERL work, tool interoperability for MERL, the role sector silos or classifications (e.g. health vs. disaster relief) plays in fragmentation of technical support available for tool usage, and the use of OSS tools compared with use of proprietary tools.
References
- https://flosshub.org/sites/flosshub.org/files/Takhteyev-Hilts-2010.pdf
- https://www.researchgate.net/publication/221656969_Geographic_location_of_developers_at_SourceForge
- https://www.sciencedirect.com/science/article/abs/pii/S0167624508000395
- https://www.sciencedirect.com/science/article/pii/S0040162522000105
- https://merlcenter.org/guides/open-source-merl-workflows/
- https://merltech.org/designing-a-merl-github-center/
- https://blogs.worldbank.org/opendata/quality-open-source-software-how-many-eyes-are-enough