Lessons Learned from Evaluating an Open Data Platform - The Impact Assessment of Global Forest Watch

Stephanie Jamilla
Former Monitoring, Evaluation & Learning Specialist, Global Forest WatchWith edits from Katherine Shea, Gia Coelho, Amy Sample Ward, Mala Kumar and Stephanie Coker
Introduction
Global Forest Watch (GFW) is an open data platform that provides spatial information on forest change, land use cover, carbon flux, and other contextual datasets related to forests. Anyone (who has access to internet services) can come to globalforestwatch.org and take advantage of its analysis tools and dashboards to monitor where deforestation is happening and derive insights from the data. All of the datasets displayed on the main GFW map, and many additional datasets, are also downloadable off of GFW’s Open Data Portal. Additionally, the platform is also open source, with its code available on various Github repos for its front end design, backend infrastructure, and tile services. GFW is hosted by the World Resources Institute (WRI) but is also an initiative in partnership with over 100 institutions, such as the University of Maryland, Google, USAID, and more.
Figure 1: The main GFW map
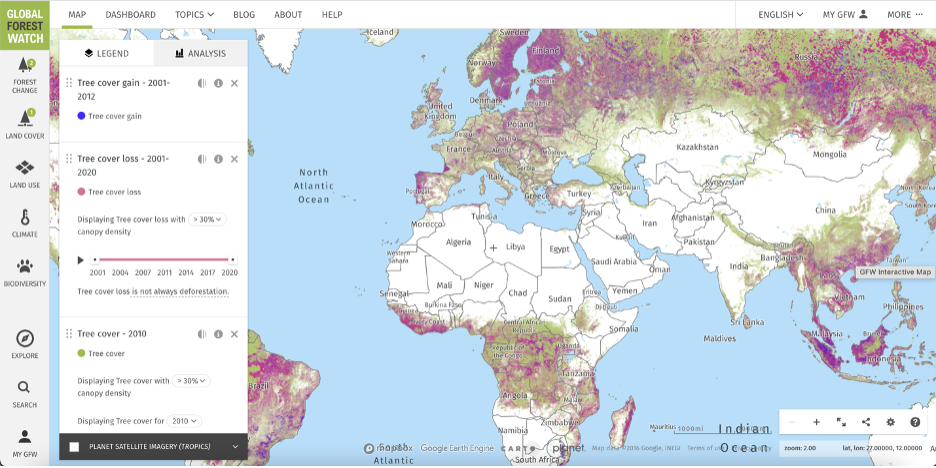
GFW’s theory of change (TOC) asserts that by providing radically transparent data about forests and free tools to analyze them, and by providing capacity building for target users, GFW is empowering forest stakeholders, from policymakers to local communities, worldwide to better protect their forests. The impact GFW aims to achieve is the reversal of deforestation trends, with a particular focus on tropical forests. As GFW approached its 5-year anniversary in 2019, the GFW team saw this milestone as an opportunity to rigorously test its TOC. With support from WRI’s Managing for Results (MfR) team that oversees monitoring and evaluation (M&E) for the whole institute, GFW M&E staff developed a mixed-method impact assessment to evaluate how well GFW was contributing to the impact it hoped to achieve. With millions of dollars invested into data platforms such as GFW, and millions of people worldwide using such platforms, it was vital to investigate the potential impacts of the platform to better inform strategies and allocation of resources.
Purpose of This Case Study
This case study will focus on the quantitative portion of the impact assessment. Its purpose is not to discuss the methods and findings of the quantitative study. Read about the quantitative study in the peer-reviewed, published article in Nature Climate Change. This piece intends to share the thinking behind why this impact assessment was conducted, the key factors that were necessary to making this assessment possible, and implications for others who would like to conduct similar studies on open data platforms. The case study is meant for measurement and evaluation professionals working on open source and/or data platforms hoping to analyze their impact and for tech professionals who design and manage such platforms.
Context
“How many trees that would have been cut down were saved due to Global Forest Watch?”
This question has come up multiple times from donors and partners, but until recently, the team had no answer. Since the GFW online platform launched in 2014, the team has proactively sought out information about how its global usership has leveraged the data and analysis tools to protect their forests. Leveraging Google Analytics was one way the team investigated trends in usage, which informed platform and product development. To supplement and complement site analytics, the team has collected anecdotal stories and outcomes of use of GFW over time. While the team has amassed a rich database of qualitative information on use cases and outcomes that platform users have achieved, and regularly use website analytics in platform decision-making, the team realized that it was time for a rigorous evaluation of GFW’s TOC.
GFW’s M&E staff, advised by WRI’s MfR team, decided that the best way to approach this first-ever impact assessment of GFW was to take a mixed-methods approach. The first component was to conduct a literature review on research that evaluated the effects of deforestation monitoring platforms. The second was to execute a quantitative study. This study was conducted with researchers from the University of Wisconsin, Oregon State University, and the University of Maryland. The third and last component was to carry out a qualitative study, conducting in focus and group interviews with on-the-ground users in tropical forest countries.
Considerations for Quantitative Assessment Design
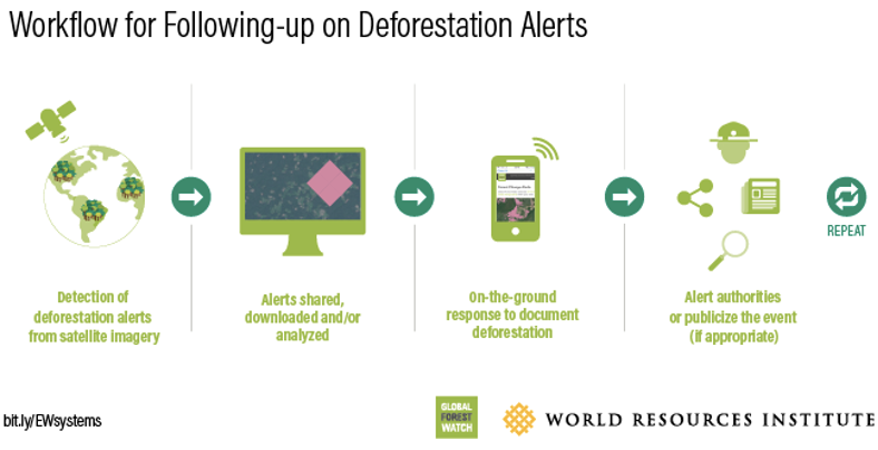
The quantitative portion of the impact assessment investigated the use of deforestation alerts, which are often used and acted upon by on-the-ground users to address deforestation. These alerts, called GLAD alerts (named after the Global Land Analysis & Discovery Lab of the University of Maryland that developed them), identifies areas of likely tree cover loss in near-real time, around every 8 days. While all data and analysis features are freely available to use on the GFW website, users can create a MyGFW account to save areas of interest (AOIs) and subscribe to receive an e-mail whenever an alert appears in their AOI. Upon receiving these e-mails, users often go to the GFW map and use the satellite imagery available to verify whether the alert is showing a true deforestation event and prioritize which alerts deserve in-field follow-up.
Fig 2: Typical workflow for GLAD alert users
The following are the main reasons why the GFW team chose to focus on this specific aspect of the platform to analyze:
- Ability to derive an analyzable sample: MyGFW users upload their AOIs onto their profile, so the team knows exactly which areas these users are monitoring. Knowing these areas allowed the team to create a sample within which deforestation rates would be analyzed.
- Information about platform users: In exchange for getting access to additional features via MyGFW, GFW requests users to fill out a form, which enables the team to learn more information about the user, such as their name, sector, how they intend to use the platform, and more. Knowing this additional information allowed the team to be able to determine which MyGFW users would most likely use the platform to monitor for deforestation with the intent to control and address it. For example, an academic researcher most likely wouldn’t respond to on-the-ground deforestation events, whereas a national park ranger would. The team was able to further limit the sample by only looking at areas saved by these users “with intent” to monitor deforestation, thus are areas that had the highest chance of being affected by GFW users.
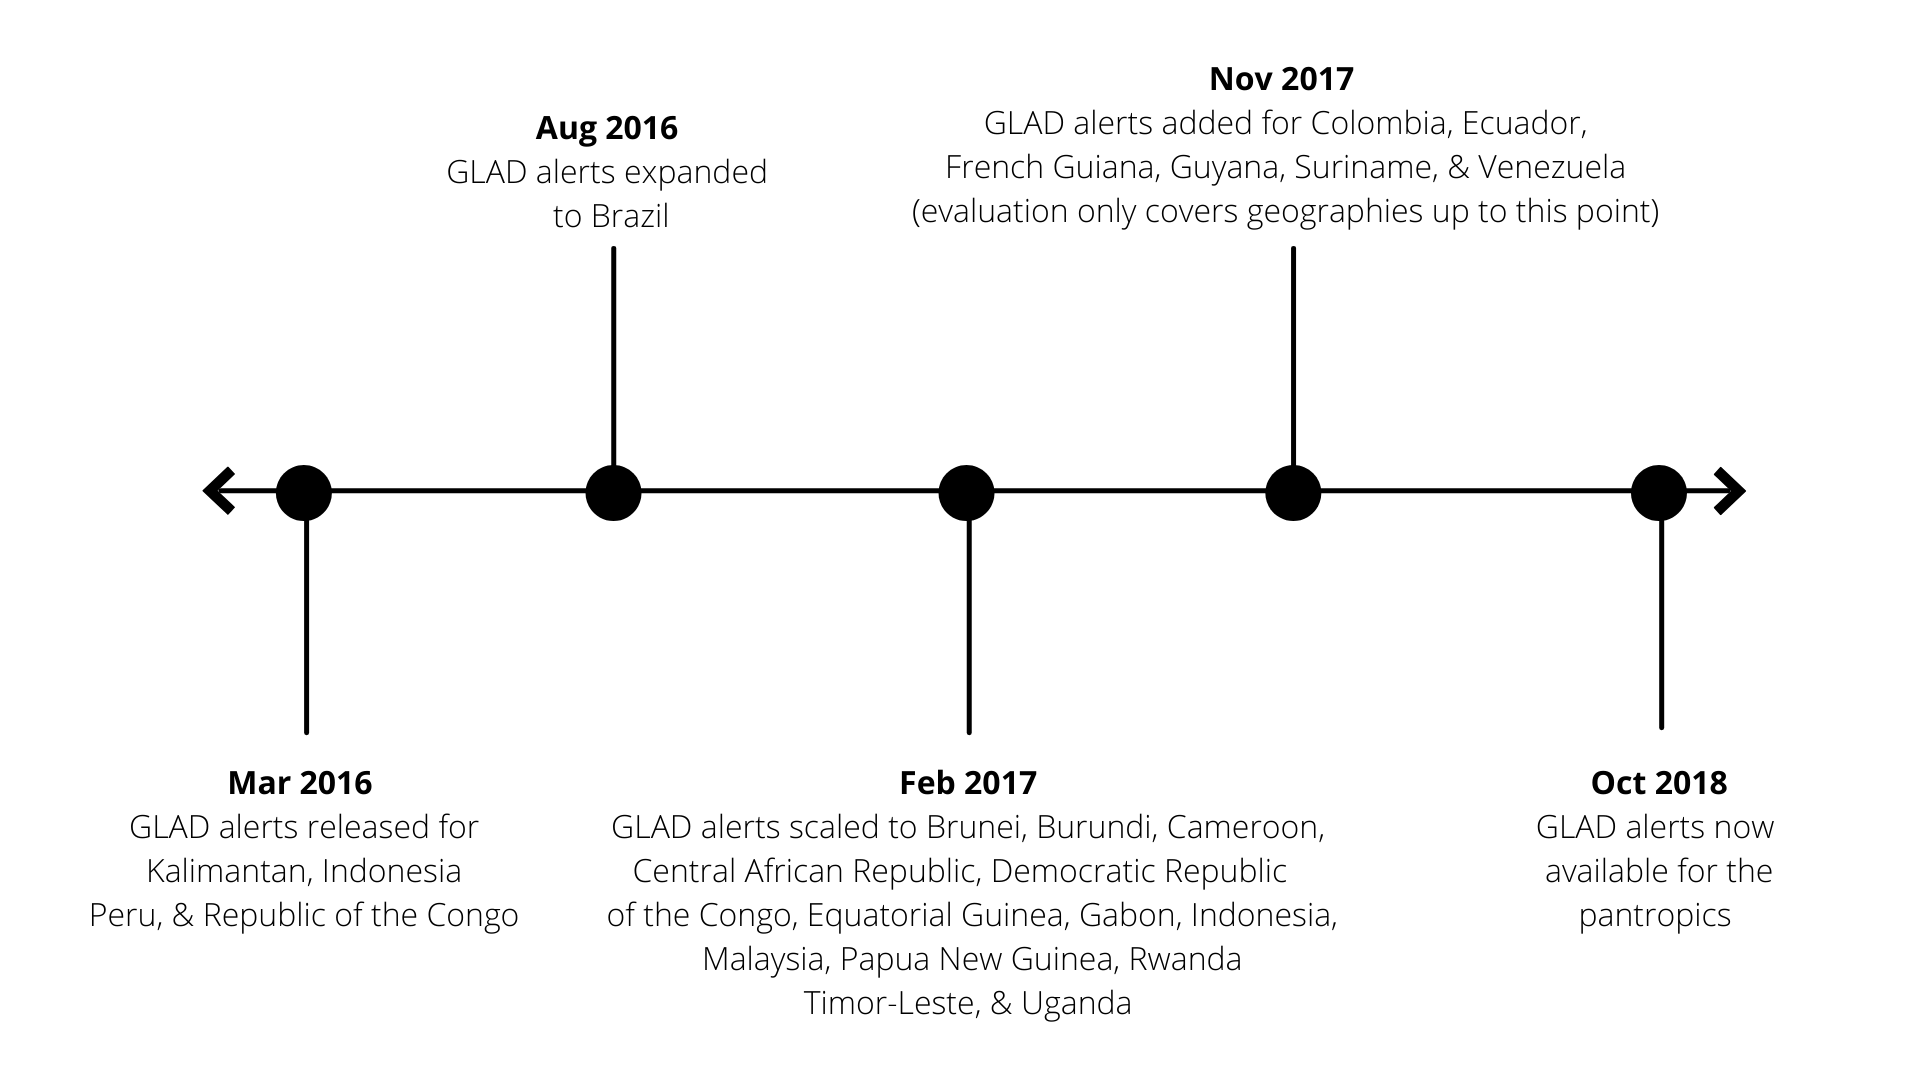
- Advantageous characteristics of alerts: GLAD alerts were not made across all geographies at the same time. There were a series of roll outs, starting with its launch in March 2016 for Peru, Republic of the Congo, and Kalimantan, Indonesia. Over the next year, alerts were expanded gradually to additional countries and eventually covered the pantropics by late 2018. This study only looked at areas covered by GLAD alerts up until September 2018. Researchers took advantage of this staged roll out to analyze countries that were covered by alerts earlier (the treatment group) compared to those that were covered by alerts later (the control), to estimate the impact of alert availability on deforestation rates. Similarly, since different users subscribed to areas over time, earlier subscriptions were analyzed (treatment) in relation to later subscriptions (control), to estimate the impact of using GLAD alerts for monitoring by “with intent” users.
Fig 3: Timeline of GLAD alert rollout
Key Findings from the Quantitative Analysis
The following are brief, key findings from the quantitative study (read the full results on Nature Climate Change or on GFW’s blog):
- There was no significant evidence of impact of alert availability on deforestation rates.
- There was a statistically significant 18% reduction in deforestation in Central Africa within areas monitored by “with intent” MyGFW users, relative to average 2011-2016 levels.
- The decrease in deforestation was higher in protected areas (e.g., national parks, wildlife reserves) and logging concessions (i.e., areas allocated by governments to private companies to manage and extract timber/wood products from public forests via forest permits, tenures, licenses, etc.). This suggests use of GLAD alerts in these areas and the consequent reduction in deforestation was in relation to illegal deforestation.
Lessons Learned
There were two main lessons learned from this quantitative evaluation:
- Design data platforms with M&E/assessment needs in mind
- Ensure that the data platform has a detailed theory of change
The only reason why this quantitative assessment was possible was because the GFW platform was set up in a way that made itself evaluable. If not for the MyGFW subscription service, the GFW team and external researchers would have no idea where GFW users were looking, which forests they were monitoring, and would not have had an analyzable sample. While it is important that open data are as accessible as possible, and the GFW team and WRI are committed to data transparency, it is also extremely advantageous to provide that data to the public in a way that would allow the data providers to better understand how the data are being used and what the outcomes and impact of that usage are. All data and analysis tools are free to use for GFW, and the MyGFW subscription service is also free, but the small amount of information the team receives from users in exchange for offering access to these additional features gives the team the necessary information to produce insights that in turn help inform platform improvements.
GFW was also strategically placed to be evaluated because the team had a good sense of both target and actual users of the platform. One advantage was that GFW had clearly mapped out its TOC and the pathways that target users can contribute to reducing deforestation by applying GFW information. This allowed the team to refine which impact pathway should be investigated in this impact assessment, and narrow the scope of an evaluation that otherwise would have been too broad. The very nature of open data platforms allows anyone to access and use them. While open access supports the goal of transparency, it can pose a challenge for data providers to understand their user base. Thus, it is important for open data providers to map who ideal users are and how those users apply the open data to contribute to the desired impact. Ideally, this process would take place at the initial planning stages of the data platform, with the understanding that the TOC may change over time, especially if users end up employing the data in unanticipated ways. The more detailed the TOC, the easier it is to target impact assessments to test certain portions of the TOC or assumptions laid out in it and adjust the TOC based on findings.
Next Steps
For the GFW team, the quantitative assessment, and this mixed-methods impact assessment overall, mainly affirmed the importance of engaging with on-the-ground, in-field users who directly respond to deforestation alerts. A large portion of GFW’s engagement activities involve investing in and providing technical support to such users, so findings from the impact assessment have been incorporated into GFW’s engagement strategies. The GFW team hopes to replicate and improve this study in the future. In the meantime, the team is currently conducting an evaluation with external researchers on another part of GFW’s TOC focused on deforestation policy. This evaluation tests assumptions on how the platform promotes transparency and accountability for international commitments aimed to reduce tropical deforestation (e.g., zero deforestation commitments by multinational companies). The researchers and the team expect to finish the evaluation in 2022.